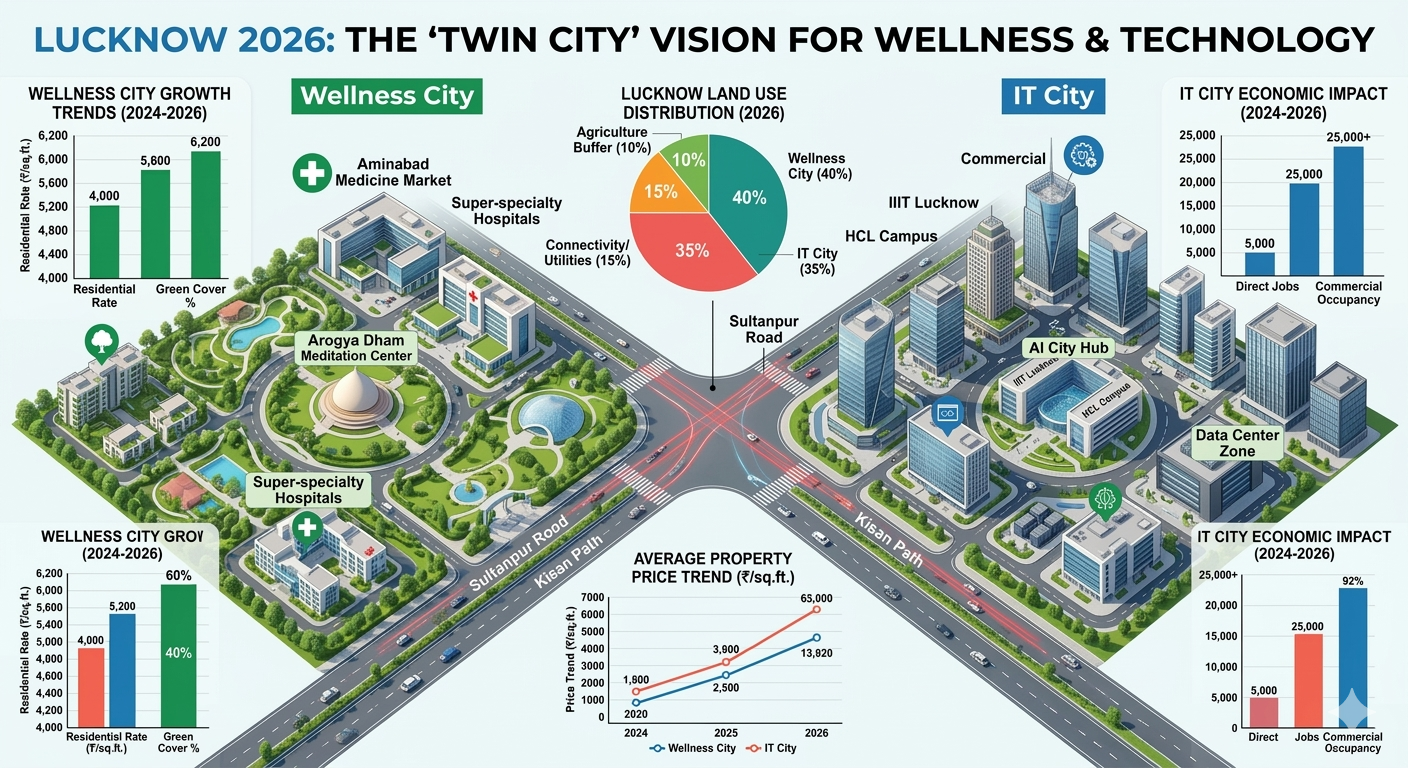
Synergy Graph: Wellness vs. IT City
The "Golden Corridor" (Sultanpur Road) creates a balance between economic output and quality of life.
Land Use Distribution (Comparison)
- IT City: 60% Commercial/Tech | 40% Residential/Social Infra.
- Wellness City: 17% Strict Green Cover | 25% Healthcare/Meditation | 58% Premium Residential.
Analytics Insight: The proximity of these two cities has created a "High-Value Circle." Tech professionals from IT City are the primary buyers in Wellness City, leading to a 15-18% rental yield increase in the surrounding Sultanpur Road micro-market.
Key Comparisons: IT City vs. Wellness City (2026)
| Feature | IT City | Wellness City |
|---|---|---|
| Total Area | 2,858 Acres | 1,474 Acres |
| Primary Focus | Employment & AI Economy | Health & Preventive Care |
| No. of Plots | 4,025 Plots | 2,935 Plots |
| Key Landmark | IIIT-Lucknow / HCL | Medical Hub / Vipassana Center |
| Best For | Rentals & Commercial ROI | Premium Living & Retirement |
Year Price Trend (2024 – 2026)
The following graph illustrates the rapid appreciation of both residential plots (measured in ₹ per sq. ft.) and agricultural village land (measured in ₹ Cr per Bigha) within these zones.
| Year | Wellness City (Resi) | IT City (Resi) | Village Land (Agri) |
|---|---|---|---|
| 2024 | ₹4,000 /sq. ft. | ₹3,500 /sq. ft. | ₹1.35 Cr / Bigha |
| 2025 | ₹5,100 /sq. ft. | ₹4,600 /sq. ft. | ₹1.70 Cr / Bigha |
| 2026 (Current) | ₹6,200 /sq. ft. | ₹5,800 /sq. ft. | ₹2.10 Cr / Bigha |
Key Data Insights & Analytics
- The "Wellness Premium": Residential rates in Wellness City consistently command a 7–10% premium over IT City. This is attributed to the lower density planning and the "high-health" infrastructure (green belts and medical hubs) which attracts HNI (High Net-worth Individual) investors and retirees.
- Agricultural Appreciation: Village land prices in areas like Bakkas, Mastemau, and Dularmau have seen a CAGR (Compound Annual Growth Rate) of ~25%. The jump from ₹1.35 Cr to ₹2.10 Cr per Bigha is largely driven by the LDA's "Land Pooling Model," where farmers are now more willing to participate in exchange for developed plots.
- IT City Catch-up: While IT City started at a lower price point in 2024, its growth rate in 2025-26 has been steeper (~26% YoY) due to the completion of the Kisan Path and the operationalization of data centers, which created an immediate demand for mid-segment housing for tech professionals.
- Market Liquidity: As of March 2026, the secondary market for plots in Wellness City (Sectors 1-3) is reporting a "time-to-sell" of less than 30 days, indicating high liquidity compared to the traditional 90-day average in other Lucknow sub-markets.


Leave a Comment